1. Overview
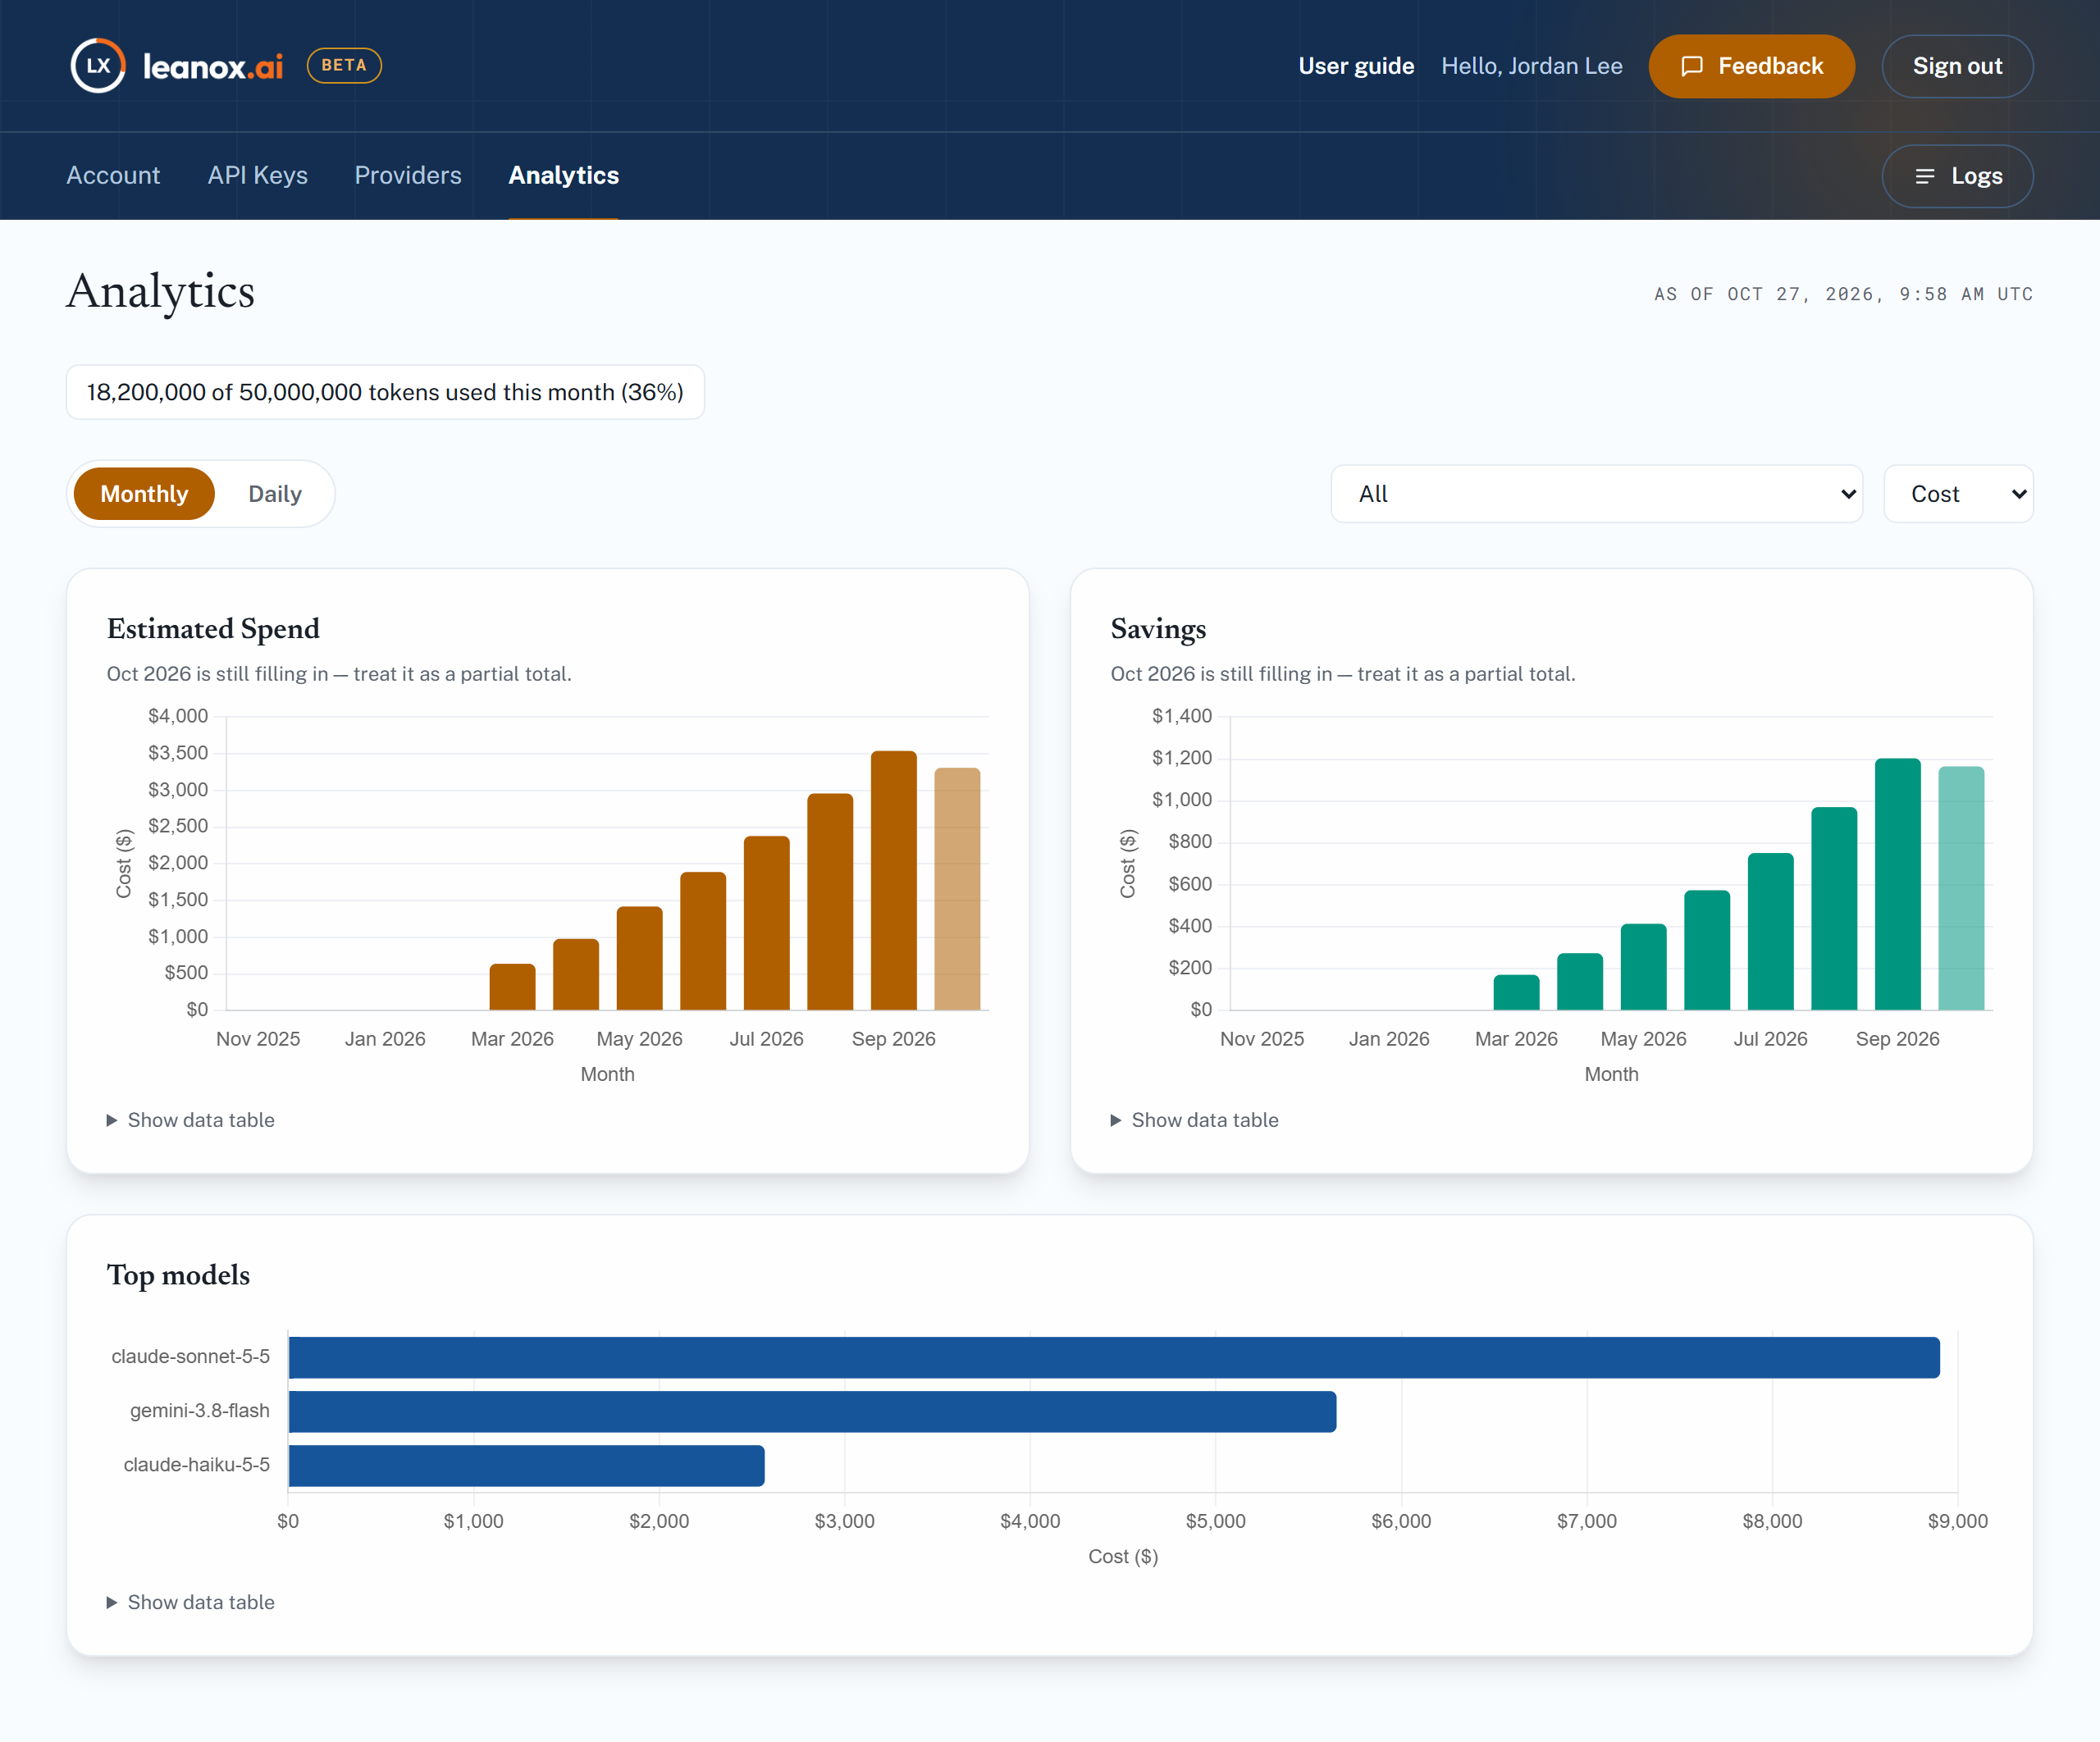
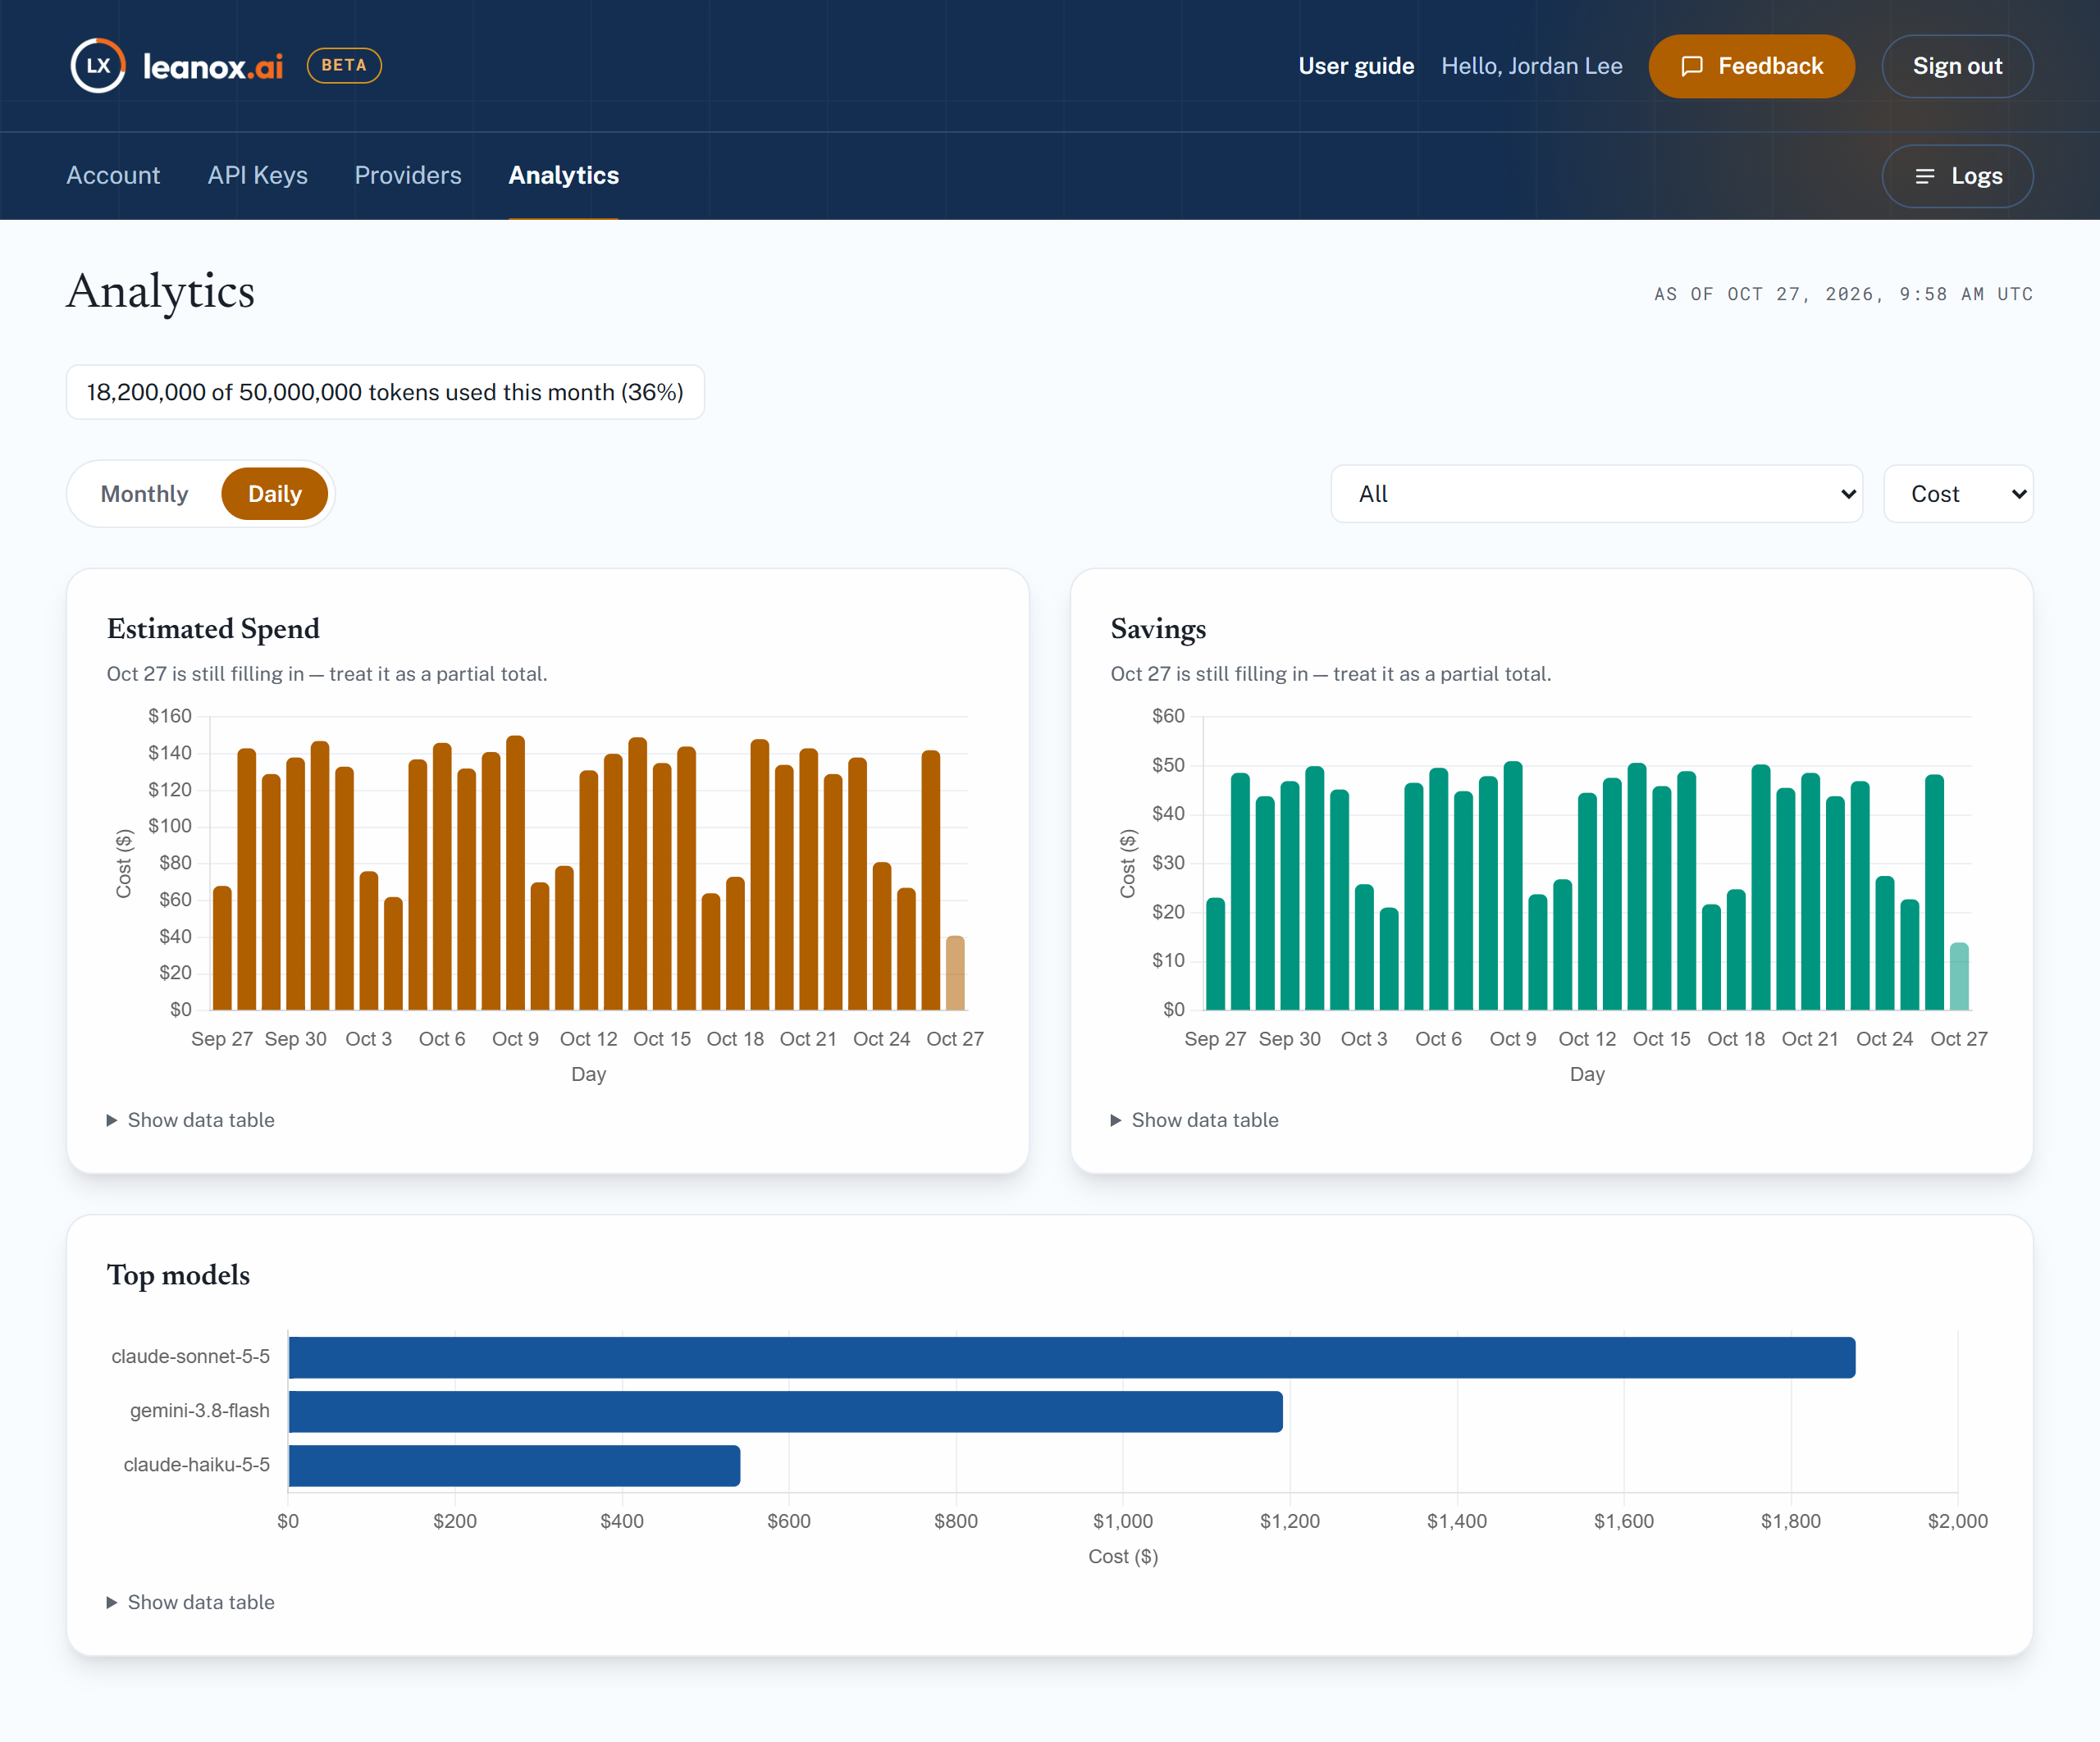
The Analytics page answers three questions: how much you're spending, how much LEANOX.AI is saving you, and which models drive your usage. It shows three charts:
- Estimated Spend — our estimate of what your requests cost at the provider's list prices.
- Savings (green) — what LEANOX.AI saved you.
- Top models — the provider models you used, ranked by dollar spend or by tokens.
Why "Estimated"? Spend is calculated from the tokens each request used, multiplied by the provider's published prices. Your provider's invoice is the final word: it may differ slightly because of discounts, credits, taxes or price changes.
Below the title, the usage line shows your tokens used this month out of your plan's quota, as on the Account page (see Sign out and your token quota).
The timestamp under the page title shows how current the data is: Analytics includes every request recorded up to that time. It's the same for all accounts, not the time of your own last request — to check your own requests, use Logs. If it reads no events recorded yet, no new data has arrived recently; check again in a few minutes.
2. Controls
- Monthly / Daily — switch the time range (see Monthly view and Daily view below).
- Key — All (the default) shows your whole account. Pick a single key to see just that application. Revoked keys are still listed, marked revoked, so their history stays visible.
- Cost / Tokens — show the charts in dollars or in tokens.
3. Monthly view
The Monthly view shows the current month and the 11 months before it — up to a year of history. Each bar is one month. Use it to spot trends, check that savings grow with your traffic, and see which models account for most of your bill.
4. Daily view
The Daily view shows one bar per day for the last 30 days. This is a rolling window, not "month to date": on 3 February you see every day from 4 January to 3 February. Use it to catch a sudden spike — a new feature launch, a runaway job, or a key used where it shouldn't be.
5. Reading the numbers
- Partial periods. The current month (or day) is still in progress, so its bar is marked as partial. Don't compare it with a full period.
- "unknown". If you used a model we don't have prices for yet, a note above the charts lists it, and any bar that includes it shows unknown rather than a misleading partial dollar figure. Token counts are still shown. Switch to Tokens to see that usage.
- Older requests and the key filter. Requests sent before per-key tracking was introduced count under All but don't belong to any individual key.
- Updates. New requests reach Analytics and Logs within a few minutes, today's included. Reload the page to see the latest figures; the timestamp under the title shows how current they are.
- Analytics dates are in UTC. Days and months begin and end at midnight UTC. (Logs shows your local time instead.)
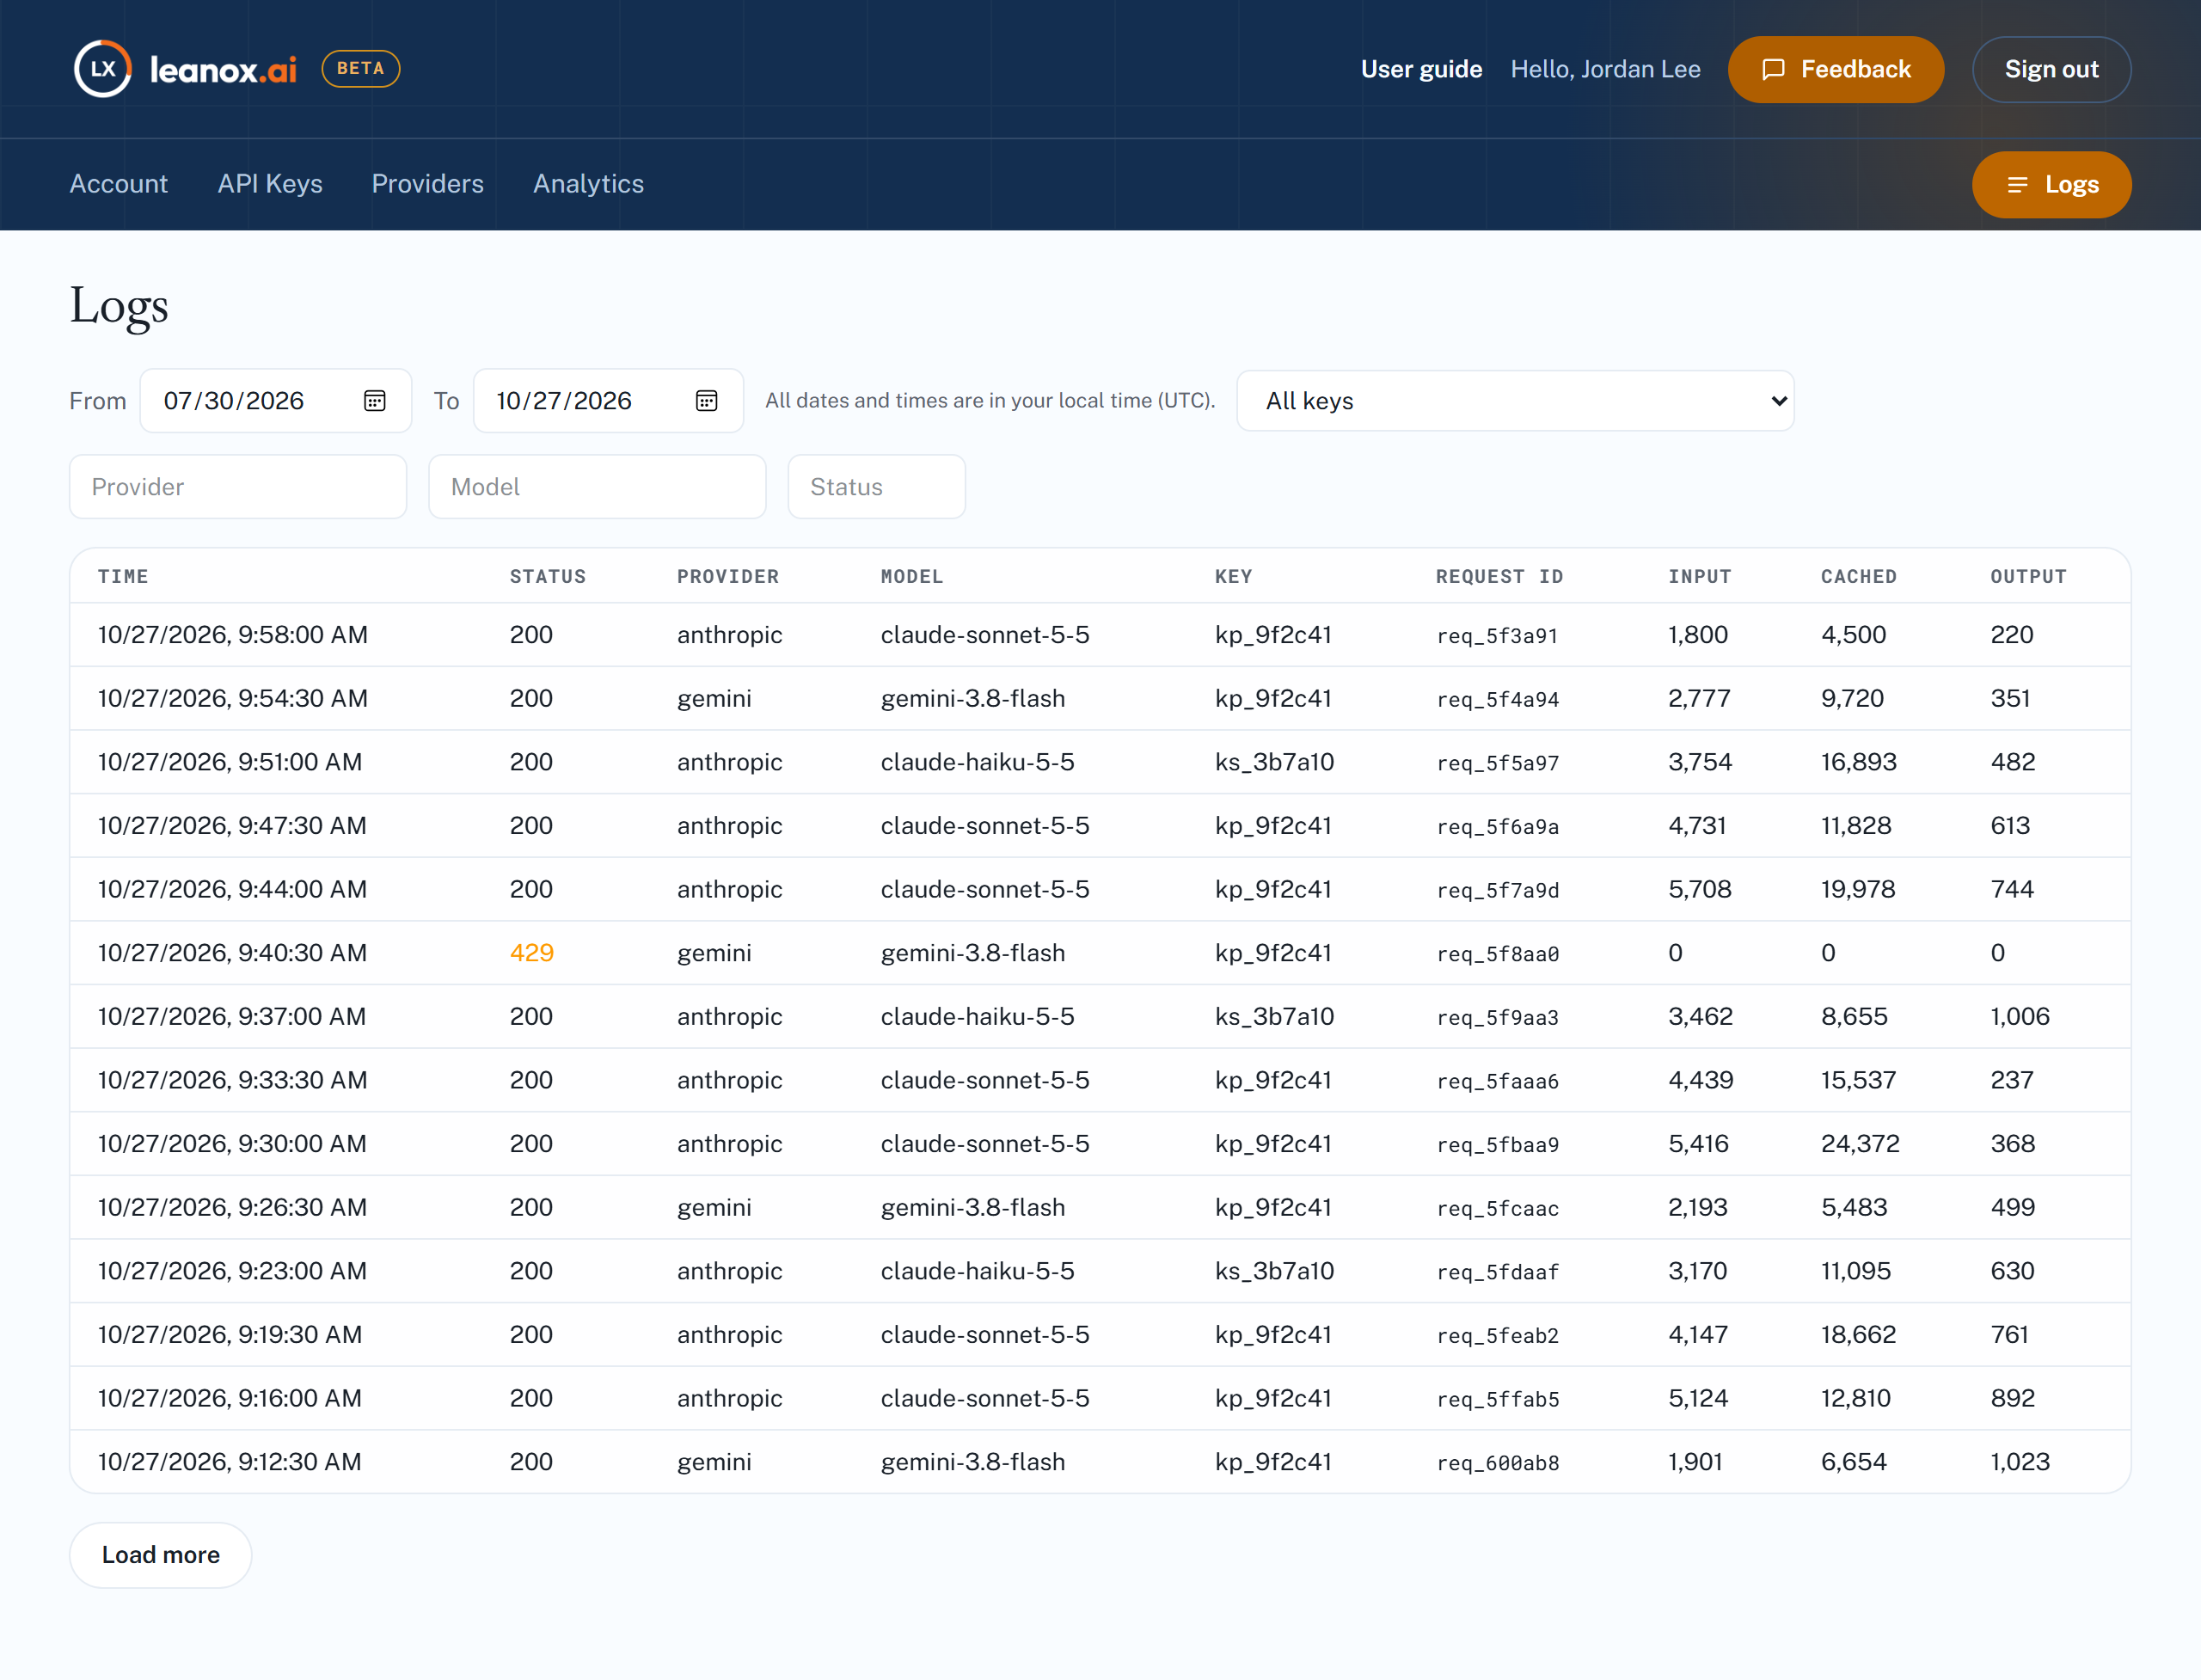
6. Logs
Click Logs in the top-right of any page. Logs lists your individual requests, newest first. It opens on the last 90 days. Each search covers up to 90 days; to see older requests, set From and To to the period you want, up to 90 days apart.
Filters: From and To dates, API key, provider, model, and status code. Dates and times in Logs are in your local time zone, which the page names next to the filters.
| Column | What it means |
|---|---|
| Time | When the request was made |
| Status | The HTTP status your provider returned: 200 means success, 4xx or 5xx means the request failed. A dash (—) means no status was recorded. |
| Provider / Model | Where the request went and which model it used |
| Key | The API key used for the request |
| Request ID | A unique reference for the request — include it when you contact support |
| Input / Cached / Output | Input tokens not served from cache, input tokens served from cache, and tokens generated. A heavily cached request can therefore show a small Input number. Tokens written to the provider's cache (for example Anthropic's cache writes) aren't shown in Logs. |
At the bottom of the list, click Load more to see older requests.
Troubleshooting with Logs: filter by a status such as 429 (rate limited by your provider) or 401 (authentication failed) to find failed requests, then use the provider, model and key columns to see which application they came from.